3 Awesome Image Tools to Create Graphics for Twitter and Facebook (They’re Free Too!)
In the recent past, a lot has been said about the importance of sharing visual content on social media. If you’re a social media marketing professional who keeps up with industry trends, you’ve already read enough and more articles about how visually represented information has a greater impact on a viewer’s brain. The arguments in favor of sharing visual content are aplenty, as are the tools you could use to create them.
When used in combination with a powerful content discovery, curation and scheduling app like DrumUp, these tools can have an exponential effect on your social media marketing efforts. Whether you’re creating images for Facebook, or images for Twitter, there are a bunch of tools you could try.
To help make the decision a tad bit easier for you, I’ve picked out three of my favorite image creation tools. Here’s a low-down on what you can do with each of them.
1. Canva
Canva is by far one of the simplest image tools I’ve ever used. It lets you create designs for social media, blogs, email, ebooks, posters and more. The tool boasts an intuitive interface, which makes it extremely easy to use, even if you have little or no experience working with such tools.
You no longer have to worry about optimizing your image sizes for Facebook or Twitter. All you need to do is pick the template that comes in the required size.
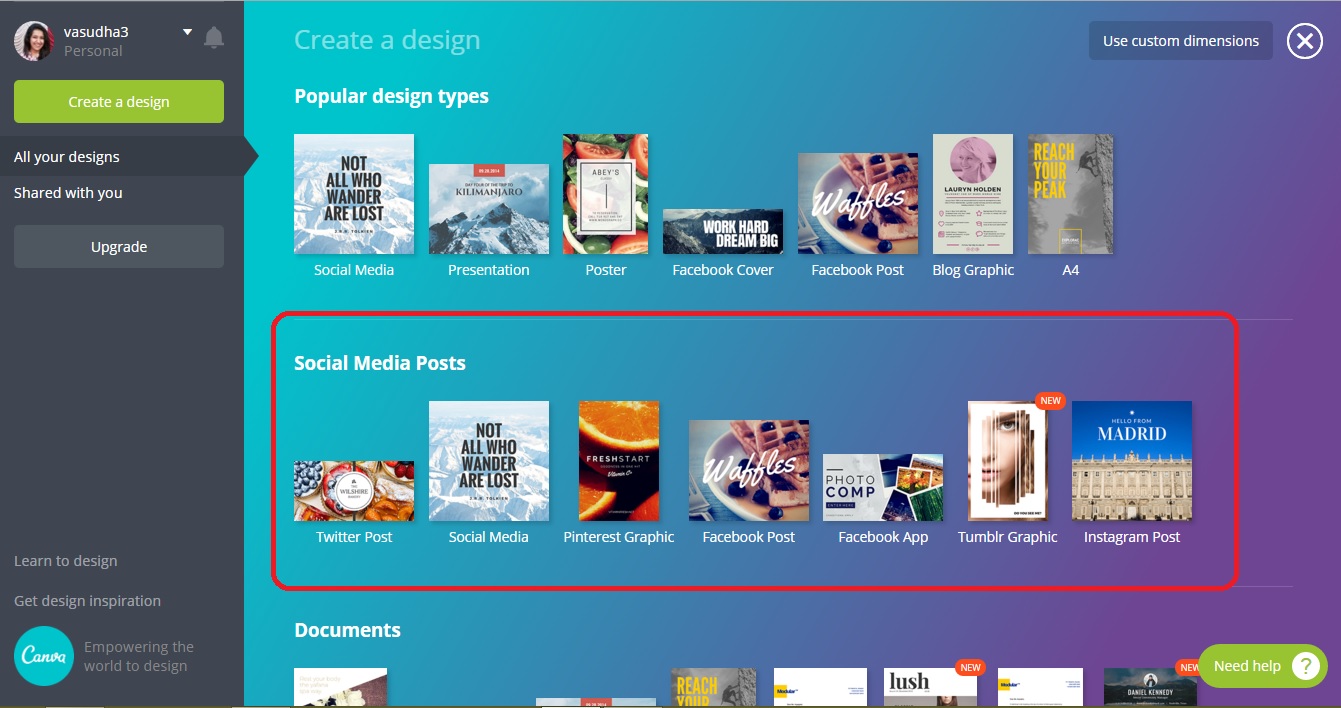
Once you’ve chosen a template, it’s time to start designing your graphic. First, pick a suitable layout from the library. Note, Canva used to be entirely free when it first launched. But now you have both free and paid templates. If you only want to use the ones that are free, look for the button that says so at the bottom-right corner of each layout.
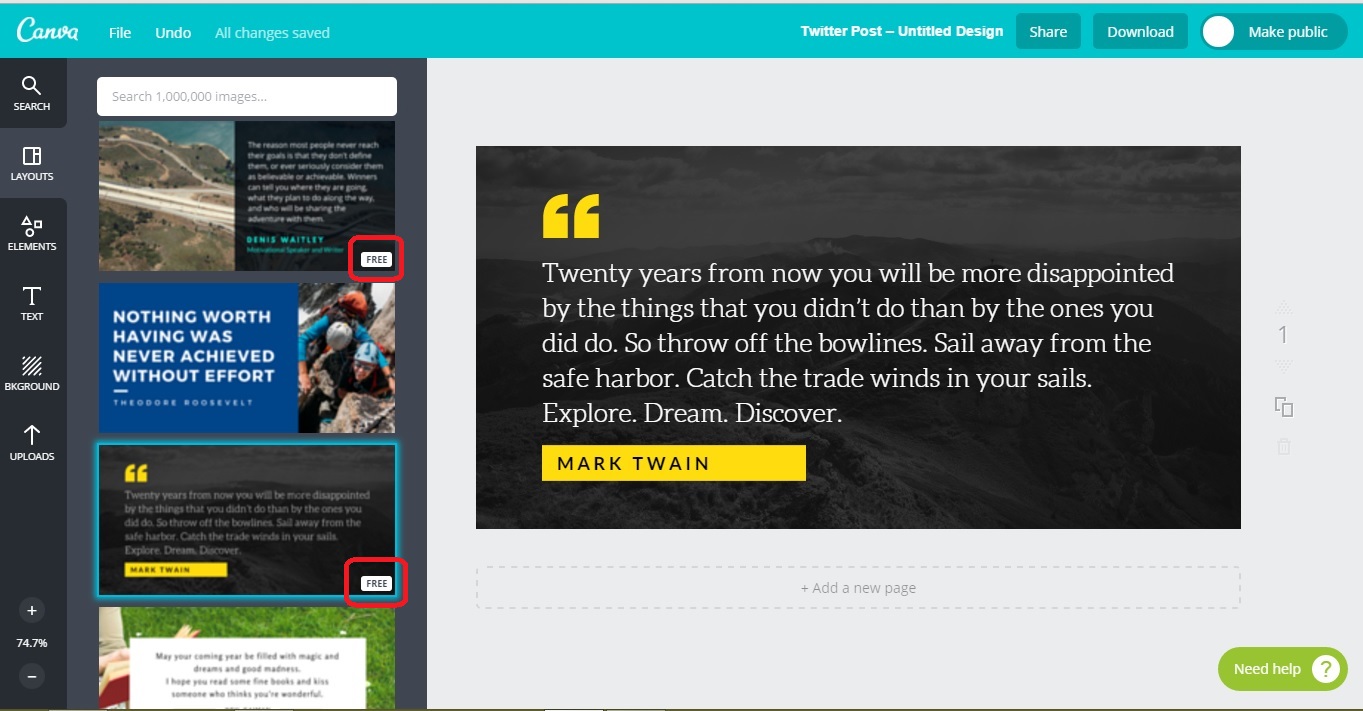
To change the background image on your chosen layout go to the Elements tab, click on Photos and run a search by keyword, or just scroll through its extensive gallery to find one you like.

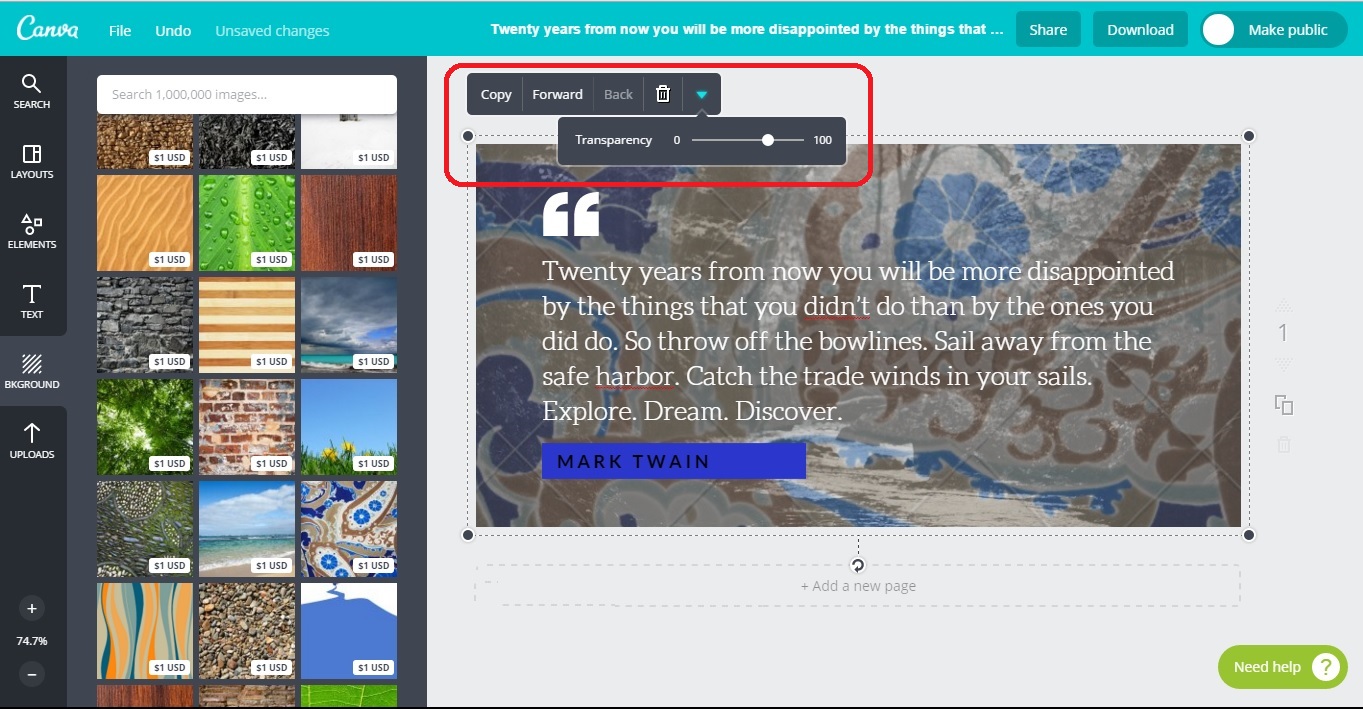
The transparency of the background is adjusted automatically. But if you’d like to customize it, you can choose from the many Filters that the tool offers.
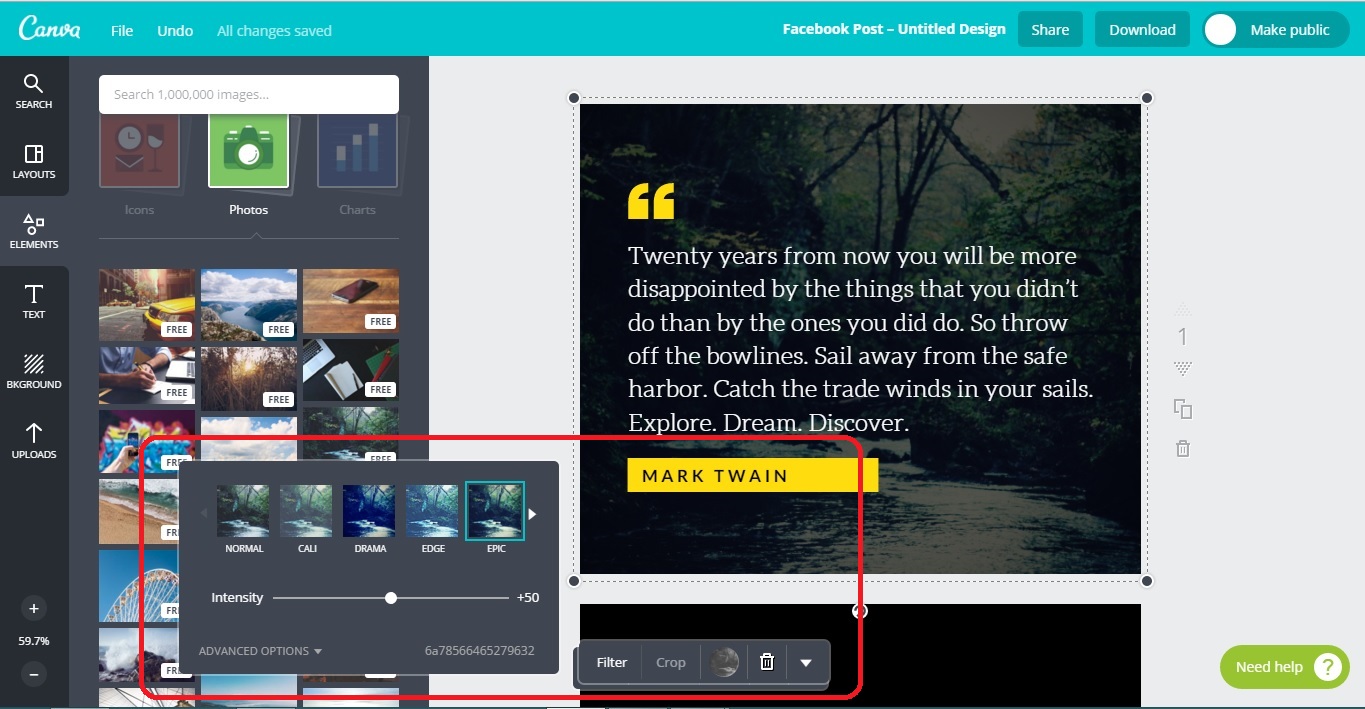
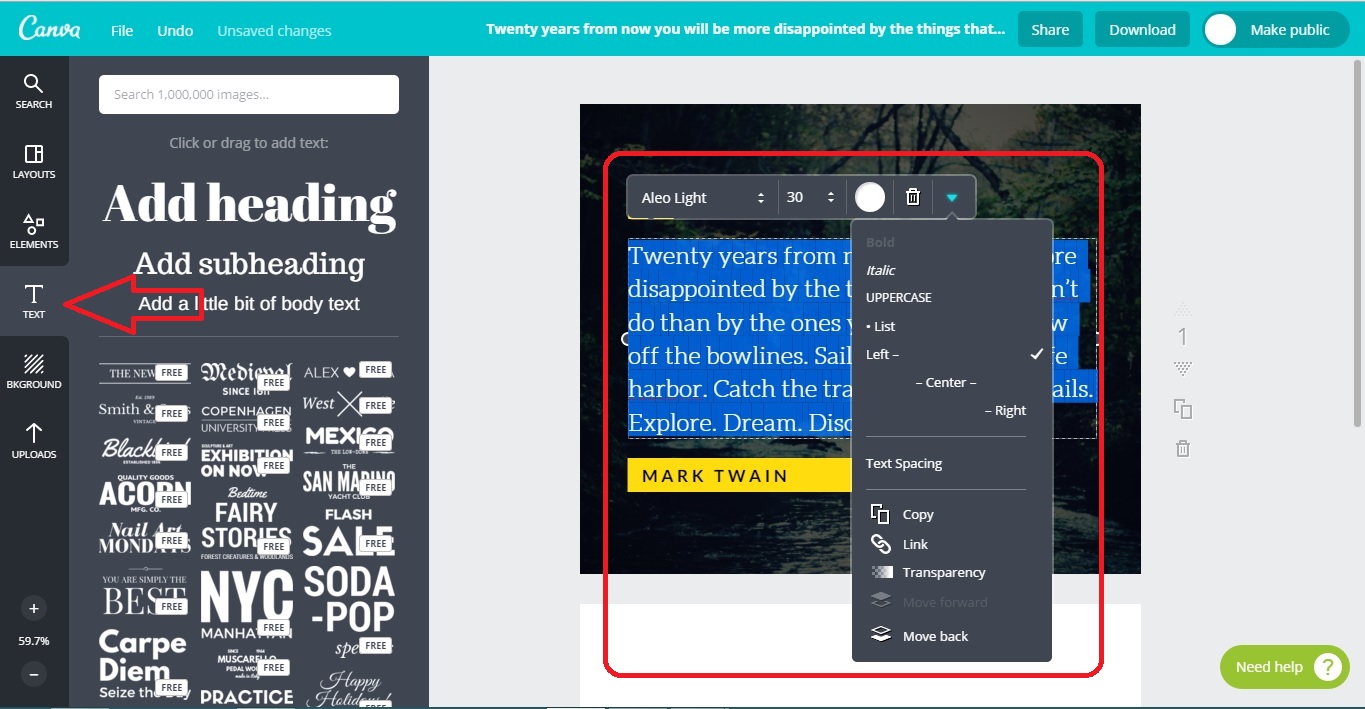
To edit the text that appears on the image, simply click anywhere on the text and make your changes in the placeholder that appears for the text. You can type-in fresh text, change font color, type and size. You can also adjust text alignment, text spacing and transparency, and add links.
 .
.
If you’re creating a simple graphic with a solid background, start with picking a suitable one from the Background tab. Adjust transparency to ensure that your text is visible and easy to read.
Once you’re done, Canva lets you share your designs directly to Facebook and Twitter. Alternatively you can share your designs via email. If you’re sharing designs with a co-creator check the box that asks to share the design in an editable format to allow the other person to make changes to your design. You can also download your designs in JPG, PNG and PDF formats.
2. Easel.ly
Like the name suggests, Easel.ly is an easy-to-use tool if you’re looking to create infographics. It’s extremely helpful in visually representing both statistical and non-statistical data. The tool is free to use, but you do need to set-up an account first. To create your account on Easel.ly, you can either use your e-mail ID, or log-in directly with Facebook, or Google+.
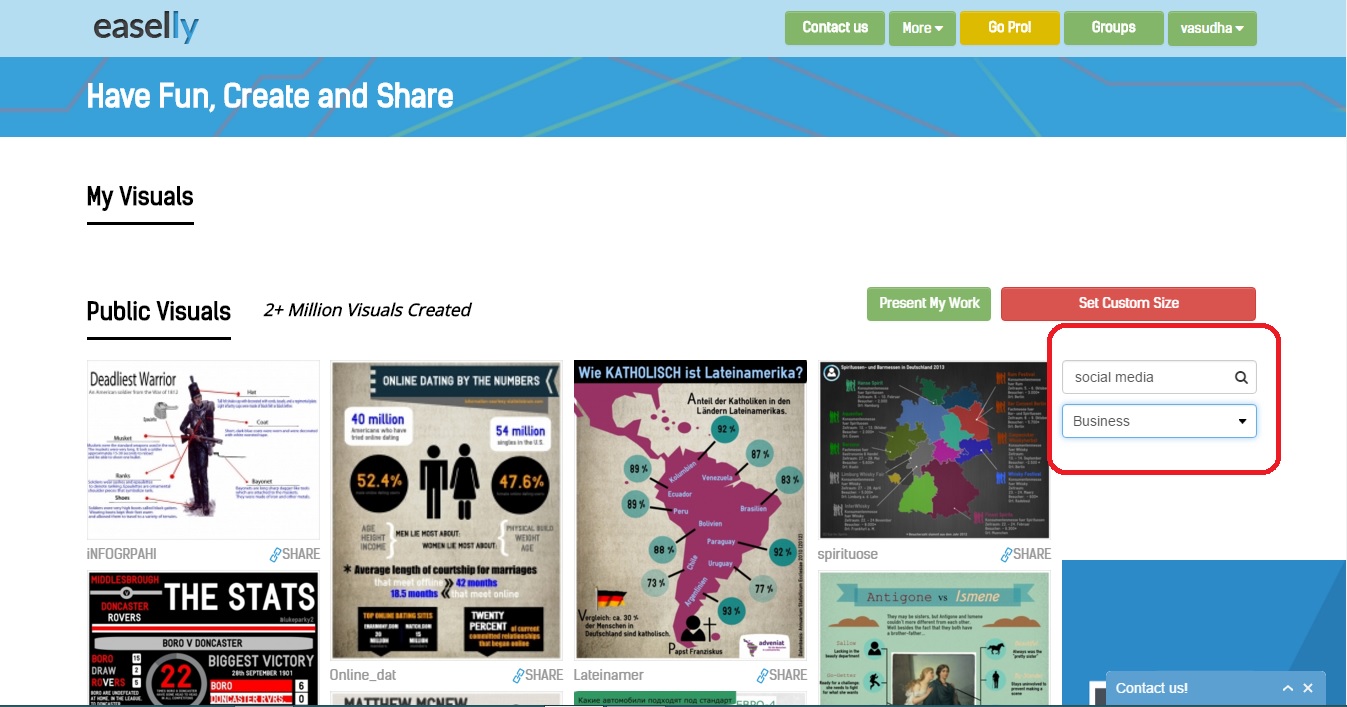
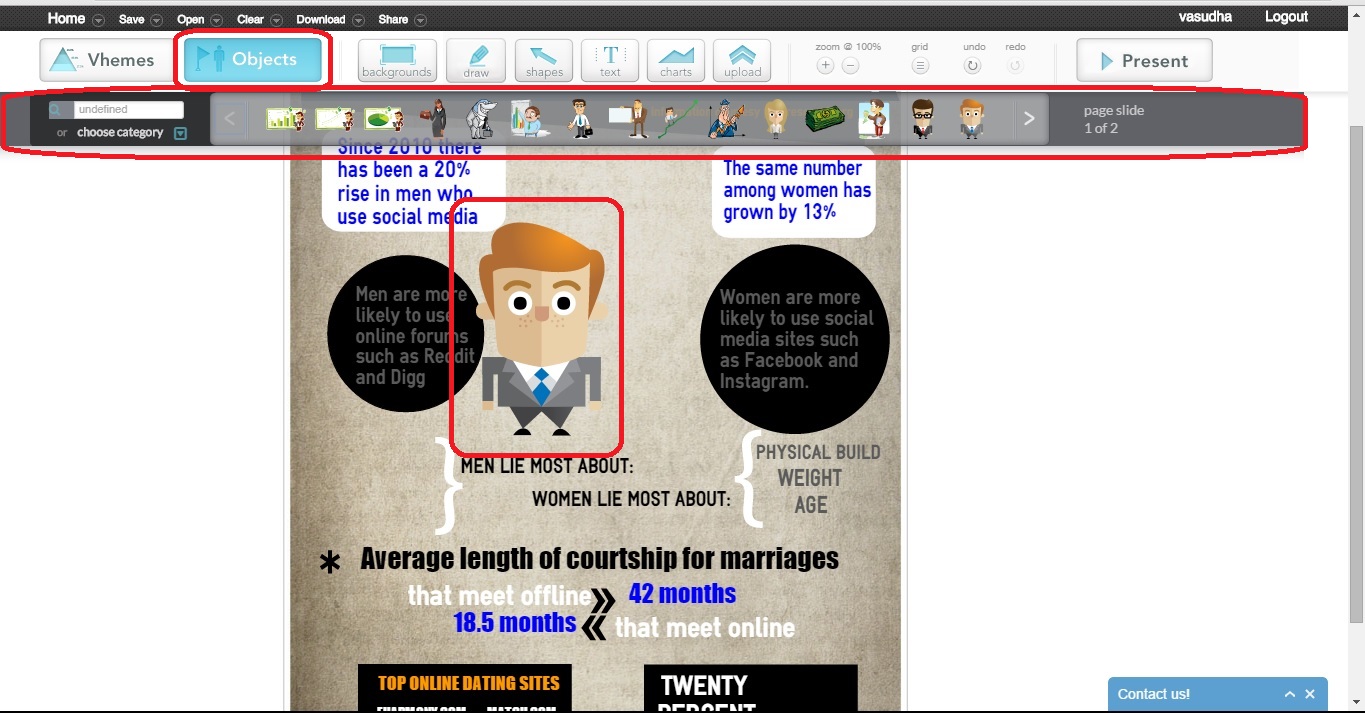
Start creating your infographic using one of the many templates you see under the Public Visuals tab right after you sign in. The search bar on the right makes it easier to find a suitable template.
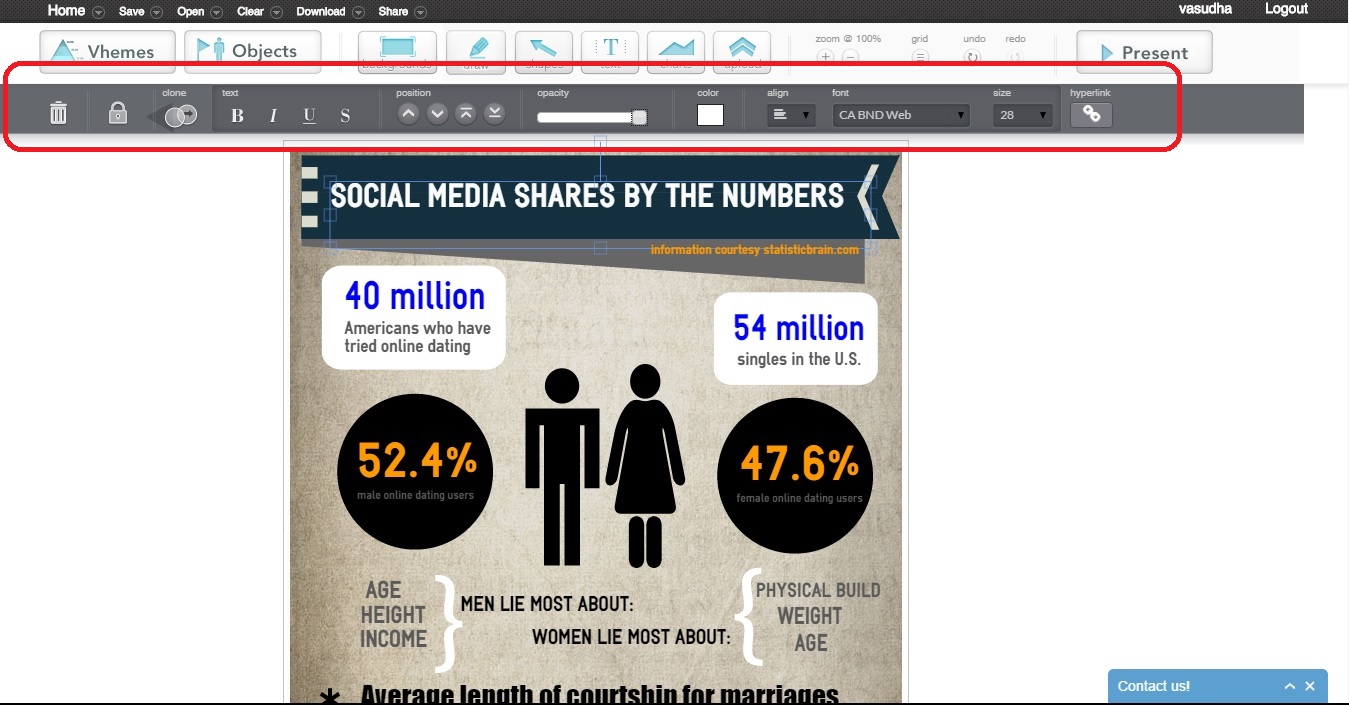
After you’ve chosen a template, you can edit each element of the design. How extensively you edit the template depends on how much you want to customize it. You could add a suitable title – when doing this you can also change the font type, size, color, opacity, and positioning. You can also add a link, delete the text, or clone it.
Note that each object on the template is editable. For instance, to update the text within the circle, you just have to click on the existing text and enter the new text after the placeholder appears.
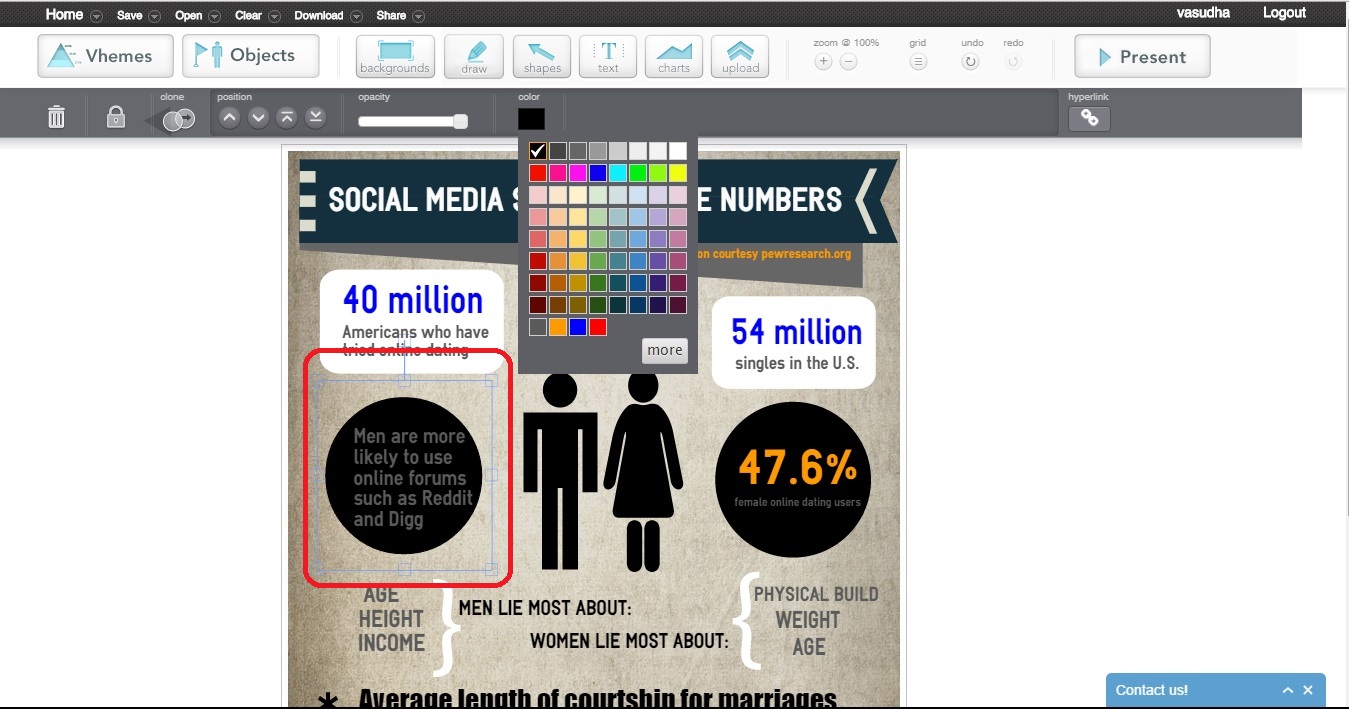
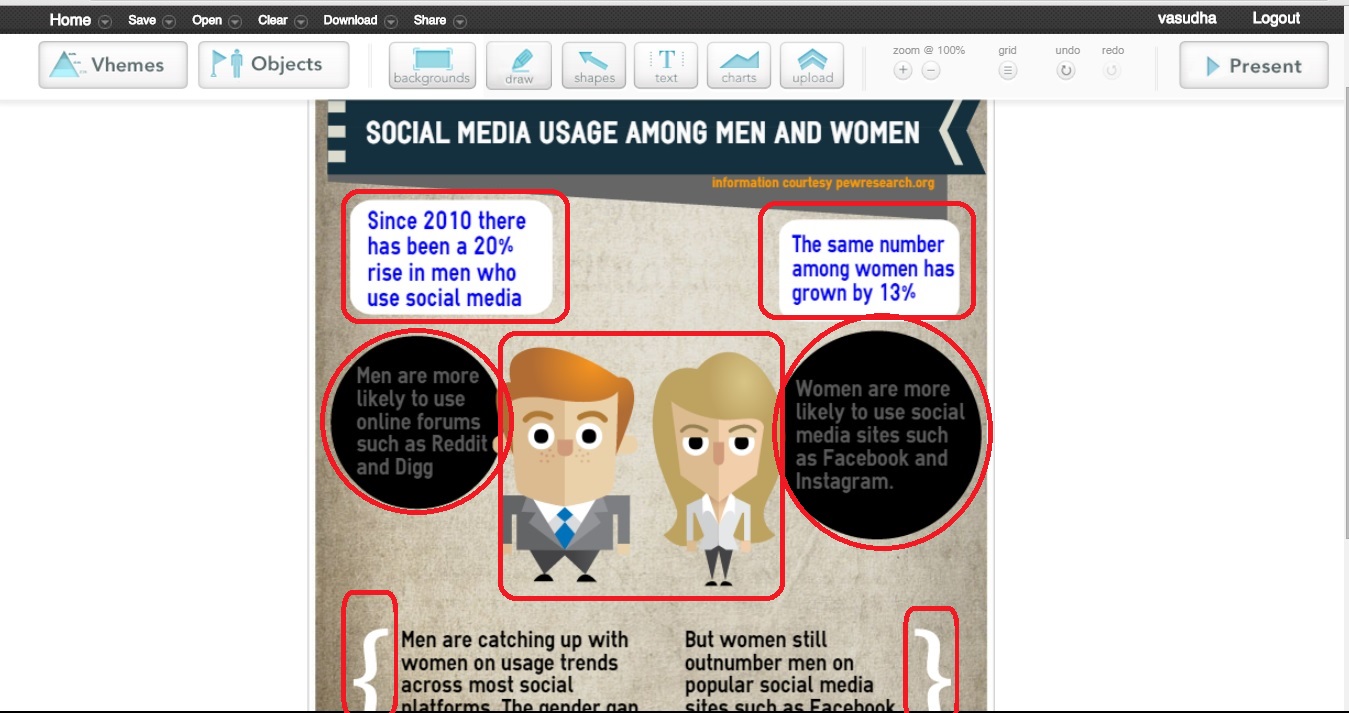
You can also replace objects entirely. As you can see in this case, I’ve replaced the male and female stick figures with slightly more animated versions of the icons.
Further, you can edit the existing design elements to alter the layout of the infographic. You can also add new elements from the Objects tab that appears on the top of your canvas area. I prefer working with existing elements simply because that’s quicker and more convenient. Here you’ll see that I’ve simply deleted the Objects I don’t want in my infographic, and modified a few of them to suit my requirement.
You can save your visual online and also download it in low-res JPG, high-res JPG, and PDF formats. Although you can’t share your visual directly to social media, you can generate a sharable link and use the same. You also have the option of sharing it via e-mail, generating an embed code, sharing to a group and viewing it in a browser.
3. Piktochart
Piktochart is another great tool you can use to create charts, infographics and presentations. You can create an account using your e-mail ID to start using the free version of the tool. Alternatively, you can also log-in through your Facebook or Google+ accounts. Just like Easel.ly, you start with choosing a suitable template. Having a paid account does give you access to a wider variety of templates, but a free account comes with some good options too.
You can either use the search bar, or scroll through the templates to pick one you’d like to work with.
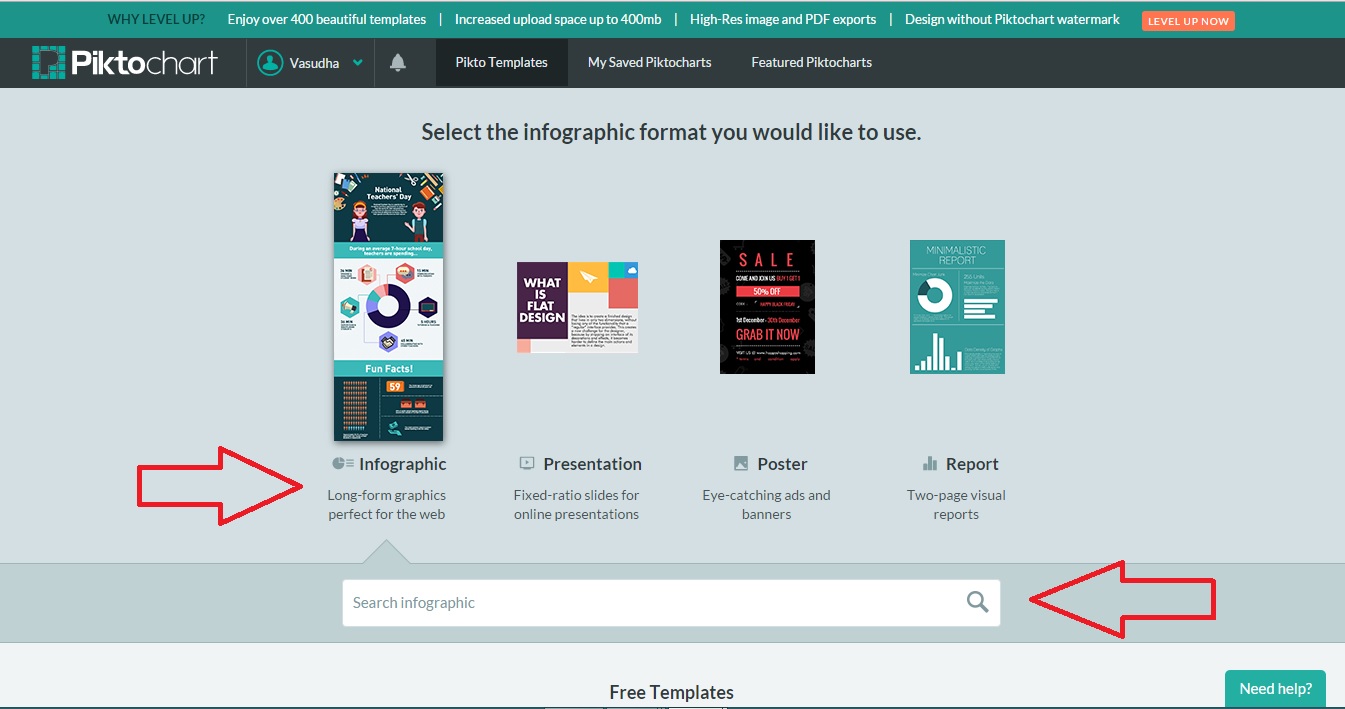
Piktochart has four categories of templates – Infographics, Presentation, Poster and Report. After you’ve selected a template, the tool lets you change the background, upload images, add graphics, edit text, create charts, add maps, and even embed videos.
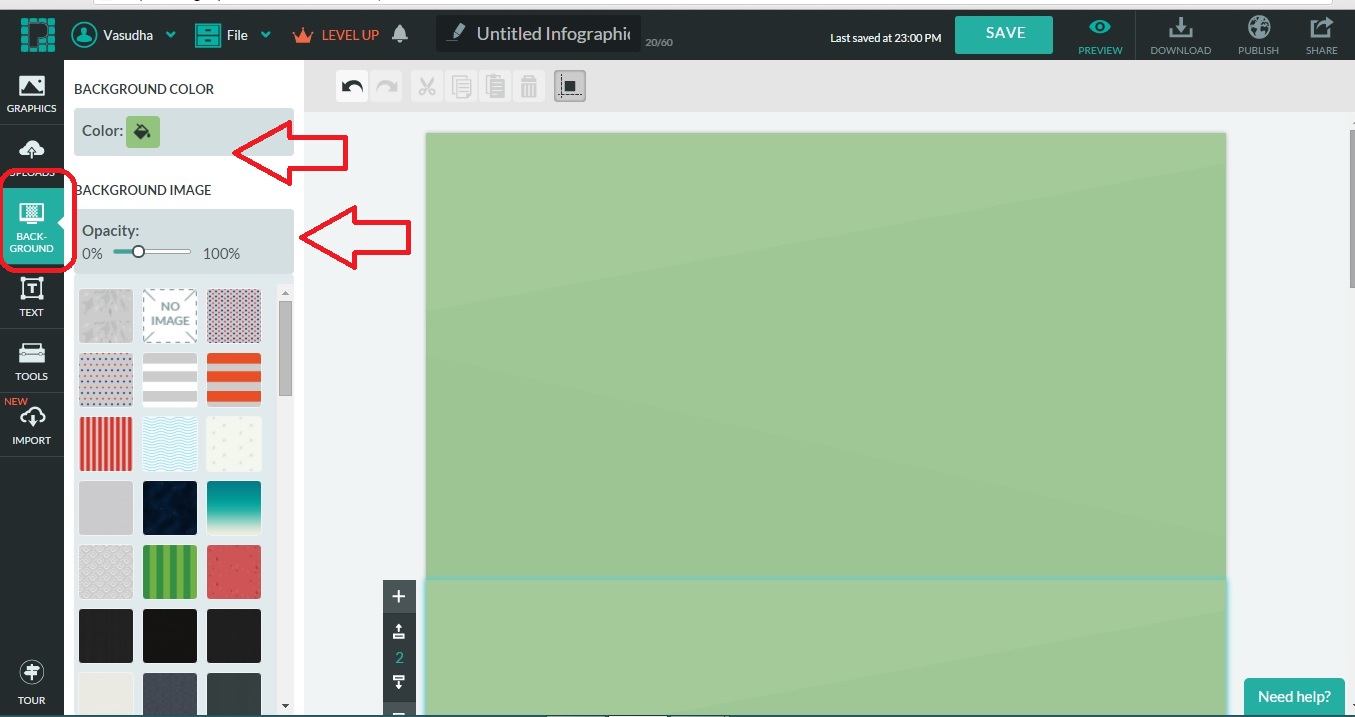
The Backgrounds on the free version of Piktochart are basic solids, with some options for solid patterns. You can adjust the opacity of the background and also change its color.
Save time managing your social media accounts
Are you still managing your social media accounts directly from Facebook/Twitter/LinkedIn? Make your life easier by managing all your social media in one place, schedule posts, repeat posts, curate content and more. Try DrumUp now, it's free, forever.
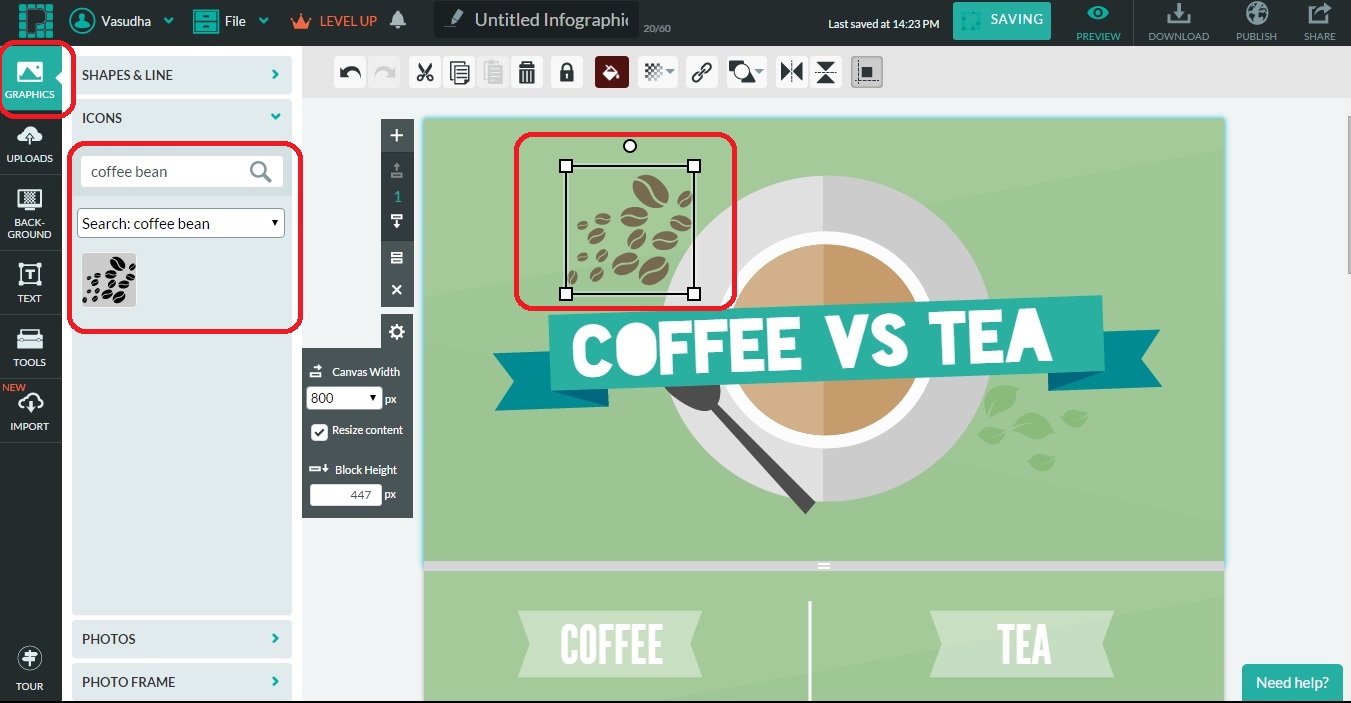
To add a graphic overlay, go to the Graphics tab and pick one of the four options – Shapes and Lines, Icons, Photos and Photo Frame. Again, the Shapes and Lines tab has a limited number of options on the free version. However, you do have a good variety of icons to choose from. The one good thing about Piktochart is that the icons aren’t cliché, so you could create some really unique designs even while working with templates.
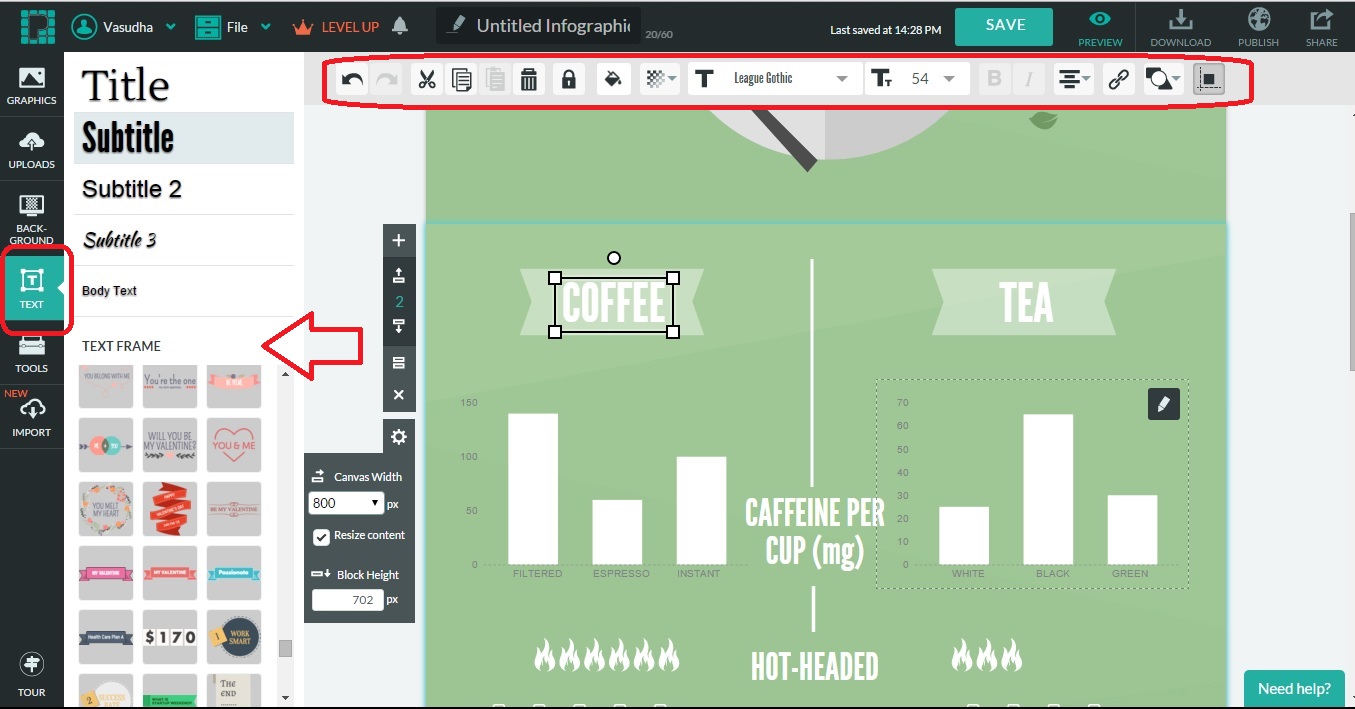
You also have a whole range of options to choose from when it comes to fonts and text frames. The only drawback with text frames on Piktochart is that you can’t change their color. If you’re going to be using text frames, you will have to pay closer attention to your color palette to make sure it isn’t off-sync.
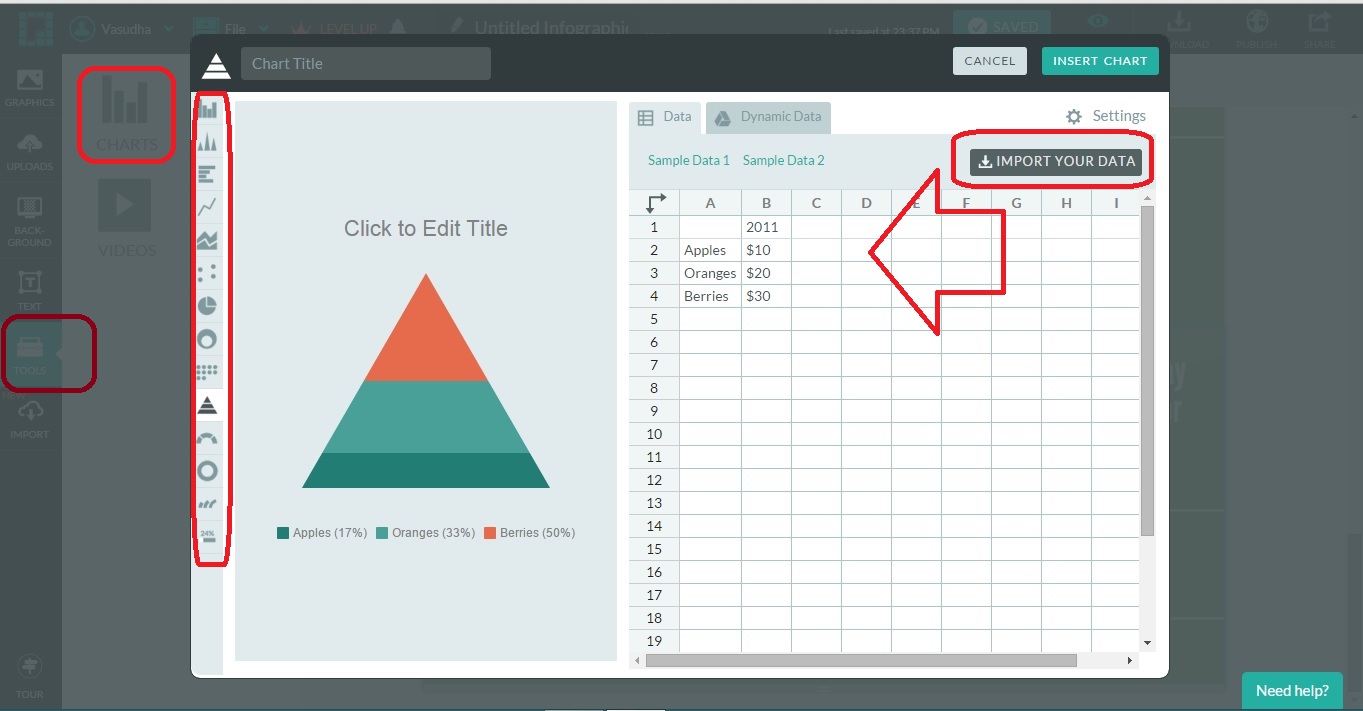
It’s also extremely easy to create statistical charts on Piktochart. Click on the Tools tab, and select Charts. You can either enter your data manually into the sheet within the pop-up, or import data from a sheet you may have saved on your computer. You can create 14 types of charts using this option, including Vertical Bar, Line, Dot, Doughnut and Icon Matrix.
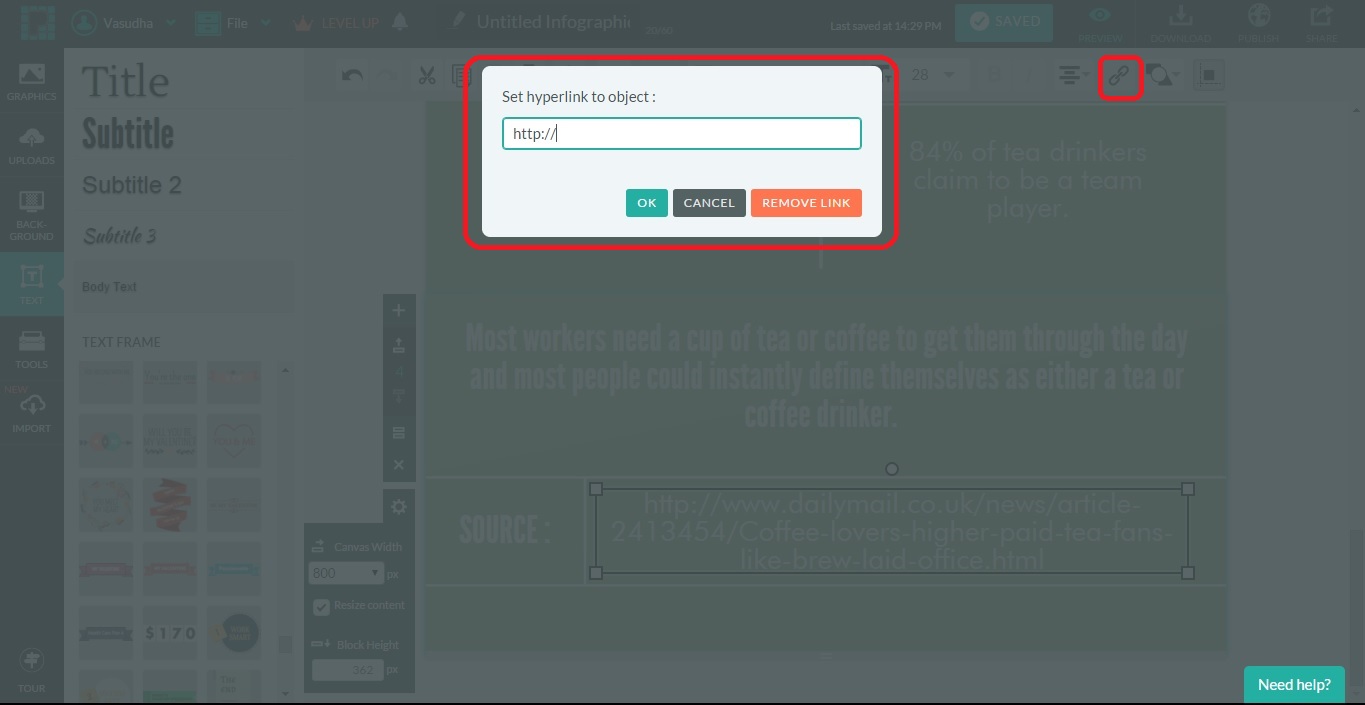
The tool also lets you add links to individual objects within your design, so you can direct readers back to your site, or a source site.
Your designs on Piktochart are saved online and can also be downloaded in JPEG and PNG formats for free. If you’ve created a more long-ish design, the tool lets you download it in blocks. You can also publish your design on the web – designs published on the free version will be visible to the public. If you’d like to share your creation directly to social media, you can do so too – the tool supports Facebook, Twitter, Google+ and Pinterest. There’s also an option to e-mail your designs.
These are my top three go-to tools for creating social media graphics. Are there any others you’d recommend?

